


The complete guide to Iceberg table maintenance — the four operations every table requires, why they must run in a specific order, and the two approaches to keeping your lake healthy: an intelligent control plane vs. manual scripts and orchestration.
The operational gap in Apache Iceberg
Apache Iceberg solved the table format problem. ACID transactions on object storage. Schema evolution without rewrites. Time travel. Hidden partitioning. Multi-engine access via REST catalogs — Spark, Trino, Flink, DuckDB, Snowflake, Athena all reading and writing the same tables through a single catalog. The format question is settled.
What Iceberg did not solve — deliberately — is the operational lifecycle. The format uses an append-only architecture: every write creates new data files and a new snapshot, every mutation adds delete markers, every schema change layers new metadata over old. Nothing is overwritten. Nothing is garbage-collected. This immutability is the source of Iceberg's transactional safety — and the source of every operational problem you will encounter in production.
From the first commit, a table accumulates structural debt. Files fragment. Snapshots pile up in metadata that planners must parse on every query. Manifests scatter. Orphaned data files accumulate on storage, visible only on cloud invoices. Delete markers force engines to reconcile them on every read. None of this is a bug. It is the consequence of an append-only architecture at scale, and Iceberg expects you to manage it.
Iceberg provides four maintenance procedures: expire_snapshots, remove_orphan_files, rewrite_data_files, and rewrite_manifests. These are raw primitives — they require external intelligence to determine when to run, in what order, on which tables, with what parameters, and how to handle conflicts with concurrent writers.
This guide covers how tables degrade, what each operation does mechanically, the critical sequencing dependency between them, and two approaches to automation: an intelligent control plane that operates as a closed-loop system, and manual scripts orchestrated through Airflow or cron.

How tables degrade
Understanding degradation mechanics matters because they determine which operation addresses which problem, and why sequencing is non-negotiable. Five distinct forms of structural debt accumulate in every Iceberg table, each with different causes, different symptoms, and different remediation.

File fragmentation
Streaming engines produce files sized by their checkpoint interval, not by what is optimal for reads. A Flink job committing every 60 seconds across 100 partitions creates 100 new data files per minute — 144,000 files per day, 4.3 million per month. Each file might contain 1–20 MB of Parquet data. The optimal read size for columnar engines is 128–512 MB. This means the table has 25–500x more files than it should for efficient scanning.
The performance impact is superlinear. Each file requires the engine to open a separate file handle, parse a Parquet footer, evaluate column statistics, and schedule a task slot. S3's per-request latency of 50–100ms means 50,000 files add 40–80 minutes of cumulative I/O overhead before computation begins. Engines that plan tasks by file count (Spark, Trino) allocate resources proportional to file count rather than data volume — a 10 GB table across 50,000 files demands more executor slots than a 1 TB table in 2,000 properly-sized files.
Batch tables are not immune. Daily ETL jobs producing one file per partition per day fragment over months — 365 files per partition per year, each below optimal size unless the daily volume fills a 512 MB target file.
Snapshot accumulation
Every Iceberg commit creates a new snapshot. A table with 5-minute commit intervals accumulates 288 snapshots per day, 8,640 per month. The metadata.json file grows linearly with snapshot count. At 100,000+ snapshots, it routinely reaches 400–600 MB. Query planners read this file on every query — a 400 MB GET on S3 adds 3–8 seconds of planning latency before the engine reads a single byte of data. For interactive dashboards expecting sub-second response, this is catastrophic.
Snapshot accumulation also blocks compaction indirectly: as long as a snapshot references a data file, that file cannot be removed. The table retains its entire write history until expiration frees the references.
Manifest fragmentation
Manifests are Iceberg's file-level index — Avro files that map data files to partitions and store per-column min/max statistics used for file pruning. Each commit appends new manifest entries. Compaction and schema evolution produce new manifests. Over time, a table with 2,000 data files might have 800 manifest files averaging 3–5 entries each, rather than the 8–12 manifests of 200+ entries each that a clean index would produce.
The query planner must read every manifest file during scan planning to evaluate which data files match the query's filter predicates. On object storage, each manifest is a separate GET request. Eight hundred 5 KB manifest reads take longer than twelve 200 KB reads — not because of bandwidth but because of per-request latency overhead. For tables where planning time dominates execution (highly selective queries on well-partitioned data), manifest fragmentation can double or triple end-to-end query time.
Iceberg 1.11's server-side scan planning — where the catalog itself resolves manifests and returns a pruned file list to the engine — makes manifest quality even more important. The catalog performs manifest traversal on every query across every connected engine. Fragmented manifests compound into catalog-level bottlenecks that affect all engines simultaneously.
Orphan file accumulation
Orphan files are data objects on storage that no live snapshot references — invisible to queries, invisible to monitoring, visible only on cloud bills. They accumulate from failed writes (files written but commit never completed), OOMed compaction jobs (partial output never registered), schema evolution retries, and snapshot expiration (which dereferences files without deleting them).
On mature lakes, orphan sweeps routinely reclaim 20–40% of billable storage. At $0.023/GB/month on S3 Standard, a 200 TB lake with 30% orphan accumulation carries $1,380/month — $16,560/year — in pure waste. The problem is insidious because nothing breaks. Queries work, dashboards are responsive. The waste accumulates silently until someone audits the storage bill.
Delete file accumulation
Iceberg supports two mutation strategies for row-level deletes and updates. Copy-on-write (CoW) rewrites entire data files to exclude deleted rows — clean but expensive for high-velocity mutation workloads. Merge-on-read (MoR) writes delete markers (positional or equality deletes) as separate files that engines reconcile at query time — cheap to write but increasingly expensive to read as delete files accumulate.
Iceberg V3 refines this with deletion vectors: Roaring bitmaps stored in Puffin files that maintain a 1:1 relationship with their parent data files. Deletion vectors are more efficient than V2 positional deletes (smaller files, faster reconciliation) but they still add per-file overhead that compounds across large tables. A table with 10,000 data files and deletion vectors on 30% of them requires engines to read and apply 3,000 additional files on every full scan.
Critically, deletion vectors and delete files do not reclaim storage — they only mark rows as invisible. The physical bytes remain on disk. Compaction is the only mechanism that actually reclaims the space by rewriting data files without the deleted rows. Until compaction runs, delete-heavy tables carry both the original data and the delete markers — paying for storage twice while also paying a query-time reconciliation penalty.
The four operations at a glance
Snapshot expiration removes snapshots beyond a configurable retention window, dereferencing the data files and manifests they exclusively held. It controls metadata growth and prevents planning-time degradation from unbounded metadata.json expansion.
Orphan file cleanup deletes data files on storage that no live snapshot references — the accumulated waste from failed writes, aborted operations, and recently expired snapshots. Pure cost reclamation with zero analytical impact.
Data file compaction merges many small files into fewer, optimally-sized files for read performance. Optionally re-sorts data by query-relevant columns for dramatic scan reduction through improved data-skipping. Resolves accumulated delete files and deletion vectors by rewriting clean data.
Manifest rewriting consolidates fragmented metadata index files into fewer, larger manifests aligned with the current data layout. Reduces query planning overhead across all engines.
These must execute in sequence: expire → orphans → compact → manifests. Each step's output is the next step's precondition. Running them independently or out of order wastes compute, leaves gaps, and can produce incorrect results. The sequencing dependency is covered in detail below.
Two approaches to maintaining your tables
The intelligence that Iceberg deliberately omits — when to run, what to target, how to sequence, how to parameterize, how to adapt to changing conditions — must come from somewhere. Two architecturally different approaches exist, and the choice between them determines the operational ceiling of your lake.
Approach 1: Intelligent control plane (recommended). A system that continuously observes every table's structural health, classifies what needs attention based on combined signals, executes the correct operations in the correct sequence with conflict safety, adapts compaction strategy based on real query patterns across all engines, and learns from outcomes to improve future decisions. This is the same closed-loop pattern used in Kubernetes: observe actual state, compare to desired state, reconcile the difference, verify the result. LakeOps is a purpose-built implementation of this for Apache Iceberg — it connects to your existing catalogs and engines through standard APIs, adds autonomous maintenance across the entire lake, and operates without moving data or replacing anything in your stack.
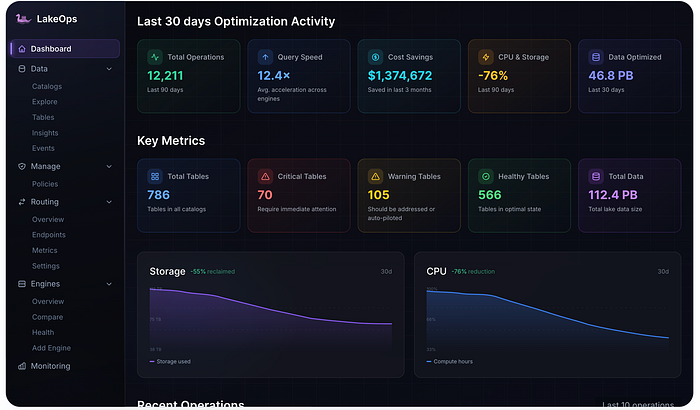
Approach 2: Manual scripts and orchestration. Airflow DAGs, cron jobs, or GitHub Actions that call Spark SQL procedures on a fixed schedule. The engineering team defines thresholds, configures frequencies, handles failures, writes the monitoring, and maintains the orchestration infrastructure. This works within specific bounds of scale and workload predictability — typically under 50 tables with stable batch-only patterns and a single query engine.
The rest of this guide covers each operation in depth, showing how both approaches handle it and where each approach reaches its structural limits.
Coordinated, autonomous maintenance across the lake

The four operations are not difficult individually. The difficulty is coordination: running them in the right order, on the right tables, at the right time, with the right parameters — continuously, across hundreds or thousands of tables with different write patterns, retention requirements, and query loads.
A batch table loading daily needs compaction weekly. A streaming table receiving sub-minute commits needs it hourly. A CDC table accumulating deletion vectors needs compaction triggered by delete-file ratio, not by time. Every table has a different maintenance profile, and that profile changes as workloads evolve. At 20 tables, per-table configuration is manageable. At 200, it is a full-time job. At 2,000, it is architecturally broken.
A control plane solves this structurally. Rather than configuring maintenance per table, you define policies that express intent — and the system continuously evaluates every table against those policies, determines what each table needs right now, and executes accordingly. LakeOps implements this as a closed-loop system: sense table health and query patterns across all engines, classify each table's urgency, plan the right operations in the right sequence, execute on a query-aware Rust engine that optimizes data layout for how queries actually access each table, and learn from outcomes to improve future decisions. Policies cascade hierarchically (organization → catalog → namespace → table) — new tables inherit correct behavior automatically, and the system scales sublinearly with table count.

Every Iceberg commit creates a snapshot — a complete pointer to the table's state at that moment. Snapshots enable time travel, safe rollback, and consistent concurrent reads. They are fundamental to Iceberg's transactional model — and the primary driver of metadata bloat.
A streaming table committing every 60 seconds produces 1,440 snapshots per day. At 5-minute intervals, that is 288 per day, 8,640 per month. Each snapshot adds entries to metadata.json, which grows linearly. At high commit velocities, it reaches 400+ MB within months — adding 3–8 seconds of planning latency per query on S3 before the engine reads a single data file. For ad-hoc queries touching small amounts of data, planning time can exceed execution time by 10x.

Expiration removes snapshots older than a retention window. Once expired, files exclusively referenced by those snapshots become eligible for deletion. The retention window defines time travel range: 7 days means you can query any historical state within a week.
Retention is workload-dependent. Streaming tables benefit from 3–7 day windows — sufficient rollback while keeping metadata lean. Batch tables can afford 14–30 days. Regulated environments (HIPAA, SOC2) may need 90+ days with full awareness of proportional metadata overhead.
With a control plane
LakeOps monitors snapshot depth continuously per table and evaluates it against the table's commit velocity and its configured retention policy. A streaming table accumulating 1,440 snapshots/day with a 3-day retention policy triggers expiration when depth exceeds 4,320 snapshots — not on a fixed 6-hour cron schedule that ignores the table's actual state. A batch table loading once daily with a 30-day policy can accumulate 30 snapshots before expiration is even relevant.
The health classification integrates snapshot depth as one of several signals. A streaming table at 5,000 snapshots with a 7-day policy scores differently than a batch table at 200 snapshots with a 30-day policy — both may be healthy or critical depending on their configured thresholds and current planning-time impact. Health is evaluated relative to each table's context, not against a universal number.
Expiration always runs as the first step in the sequenced maintenance pipeline. Files dereferenced by expiration immediately flow into orphan cleanup in the same cycle. There is no gap between "file dereferenced" and "file eligible for cleanup" — the pipeline is continuous.
With manual scripts
CALL catalog.system.expire_snapshots(
  table => 'analytics.events',
  older_than => TIMESTAMP '2026-08-16 00:00:00',
  retain_last => 100
);
The typical Airflow pattern: a scheduled job computing older_than as now() - interval '7 days' and iterating over a table list. This works correctly but runs on a fixed cadence regardless of need. A table committing every 30 seconds accumulates 720 snapshots between 6-hour windows; a table loading daily accumulates one. Both receive the same expiration frequency. The high-velocity table degrades between runs; the low-velocity table wastes compute.
Retention guidance: Set retain_last to at least 100 regardless of older_than — this provides rollback safety even if a misconfigured older_than timestamp would otherwise expire everything. For streaming tables, 3–7 days is standard. For batch, 14–30. For regulated environments, consult your compliance requirements and accept the proportional metadata overhead.
Orphan file cleanup
Orphan files have no analytical value. No query accesses them. No engine knows they exist. They sit on S3 or GCS accumulating charges indefinitely because object storage has no garbage collection and Iceberg has no automatic deletion of unreferenced files.
The accumulation mechanisms are continuous. Failed Spark stages leave behind files whose commit never completed. OOMed compaction jobs are the most prolific source: a run writing 500 new files that fails before the atomic commit leaves 500 orphans per failure. The cost impact compounds because orphans grow monotonically — every failed operation adds more, nothing removes them until explicit cleanup runs. At $0.023/GB/month, a 200 TB lake with 30% orphans carries $1,380/month in waste.
Detection requires comparing what exists on storage against what metadata references — a set-difference operation. On S3, this means LIST requests against the prefix (up to 1,000 keys per request at $0.005 per 1,000) and comparing results against file paths in all live manifests. For a table with 500,000 objects, that is 500 LIST requests just for detection.
With a control plane
LakeOps runs orphan cleanup as the second step in each maintenance cycle — immediately after snapshot expiration, so it catches both accumulated orphans and files freshly dereferenced in the same cycle. This eliminates the gap that manual approaches leave between "expired snapshot released references" and "next orphan cleanup run finds them."
The safety window (default 7 days, configurable per policy) automatically protects in-progress writes. Files younger than the safety window are never deleted regardless of their reference status, because they might belong to an active write operation that has not yet committed. No manual dry_run verification is needed because the safety threshold is enforced programmatically.
Every file removed is logged with full context in the audit trail: file path, size, age, reason for orphan classification, and the maintenance cycle that removed it. For compliance environments requiring proof of data lifecycle management, this audit trail satisfies what manual operations require custom logging to achieve.
With manual scripts
CALL catalog.system.remove_orphan_files(
  table => 'analytics.events',
  older_than => TIMESTAMP '2026-08-13 00:00:00',
  dry_run => true
);
Always run with dry_run => true first. The older_than threshold must be at least 3 days, preferably 7, to avoid deleting files from long-running writes that have not yet committed. A Spark job that writes files at the start of a 4-hour run but commits at the end has unreferenced files for 4 hours — a 1-hour threshold would classify them as orphans and corrupt the write.
The most common mistake: scheduling cleanup independently from expiration. If orphan cleanup runs Monday and expiration runs Tuesday, files dereferenced Tuesday sit as orphans until the following Monday. The second mistake: not running orphan cleanup at all. Many teams implement expiration and compaction but forget cleanup because it does not affect query performance. The files accumulate silently until the annual cost review.
Data file compaction
Compaction is the highest-impact maintenance operation — the one that most directly determines query performance. It is also the most complex, with the most parameters and the most interaction with concurrent writers.

Streaming writers produce files optimized for write latency, not read throughput. A Flink job with 60-second checkpoints across 100 partitions creates 144,000 files per day, each 1–20 MB. The target for efficient reads is 128–512 MB. At 50,000 files, the per-file overhead — S3 GET latency (50–100ms), Parquet footer parsing, task scheduling — dominates query time on selective queries.
Compaction merges small files into fewer files targeting 128–512 MB (default 512 MB, or target-file-size-bytes = 536870912). The target depends on workload: 128 MB for highly selective point lookups, 512 MB for full-scan analytics, 256 MB for mixed patterns.
Bin-pack compaction
Bin-pack reads small files, concatenates them into target-sized files, and writes the result. Data order is preserved — no sorting. Fast, safe, and the right default for tables with no dominant filter pattern or where data arrives pre-sorted from the source.
The limitation: bin-pack does nothing for data skipping. A table with 2,000 properly-sized files containing randomly distributed values in event_date still requires scanning most files for WHERE event_date = '2026-08-20', because min/max statistics in each file's row groups span the entire date range.
Sort compaction and data skipping
Sort compaction rewrites data files with rows physically ordered by specified columns. This is the single most powerful optimization available for Iceberg query performance, and it is worth understanding exactly why.
Parquet files store data in row groups, and each row group maintains statistics including the minimum and maximum value for each column. When a query filters on a column — WHERE customer_id = 'acme-corp' — the engine checks each row group's min/max statistics for that column before reading any data. If a row group's min is "delta" and max is "foxtrot", the engine knows "acme-corp" cannot exist in that row group and skips it entirely. This is data skipping, also called predicate pushdown or row-group pruning.
The effectiveness of data skipping depends entirely on how tightly the min/max bounds correlate with actual data distribution within each file. In an unsorted table, every file typically contains values spanning most or all of the column's domain — min="aardvark", max="zebra" — making every row group a candidate and skipping nothing. In a table sorted by customer_id, each file contains a contiguous range of customer IDs — min="acme-corp", max="apex-tech" — and the engine skips 95%+ of files for point lookups.
The performance difference is dramatic. On a properly sorted table, selective queries that previously scanned 100% of data files now scan 5–15%. An 8–12x improvement in query speed is typical for well-chosen sort orders. For dashboards filtering on customer, date, or region — the most common BI pattern — sort compaction regularly converts 30-second queries into sub-3-second queries without any change to the query or the engine configuration.
The sort order decision is critical and non-obvious. Sorting by one column optimizes predicates on that column but does nothing for predicates on other columns. Multi-column sort orders (e.g., customer_id, event_date) optimize the first column fully and the second column within each first-column group — diminishing returns as columns are added. Choosing the wrong sort order — sorting by a column nobody queries — wastes the entire rewrite cost with zero benefit. Choosing the right sort order requires knowledge of actual query patterns across all engines, which is information that no single engine possesses.
Delete file resolution
Compaction also resolves accumulated delete files and V3 deletion vectors. When it rewrites a data file with associated delete markers, the output contains only live rows — delete markers are dropped and storage is reclaimed for both the original data and the markers.
For merge-on-read tables with high mutation rates — CDC pipelines, slowly changing dimensions, GDPR workflows — delete file accumulation directly degrades read performance. The delete-file-threshold parameter controls how many delete files a data file must have before compaction targets it. Setting this to 1 rewrites any data file with even a single delete marker. Setting it to 10 accepts interim read degradation in exchange for less frequent compaction.
Iceberg V3 introduces deletion vectors — Roaring bitmaps stored in Puffin files with a 1:1 relationship to data files. They are more space-efficient than V2 positional deletes and faster to apply (bitmap intersection vs. sort-merge join). But they do not eliminate the fundamental problem: physical bytes of deleted data remain on storage. Compaction is still required to reclaim space. V3 makes the interim state less painful; it does not make maintenance optional.
Partial-progress mode
By default, rewrite_data_files operates as an all-or-nothing transaction. If any file group fails, the entire operation rolls back. For a run targeting 50,000 files that fails on file 49,999, all work is discarded.
Partial-progress mode (partial-progress.enabled = true) commits incrementally. The procedure groups files into batches and commits each independently. If group 47 of 50 fails, the first 46 are already committed. The partial-progress.max-commits parameter controls granularity — 10–25 is typical for large tables.
Partial-progress is not optional for production compaction. Any job without it is one S3 timeout away from losing hours of compute.
Conflict handling with concurrent writers
Iceberg uses optimistic concurrency control (OCC) for commits — writers proceed without locks and validate at commit time that no conflicting changes occurred. If a streaming writer appends new data to a partition while compaction rewrites files in that same partition, the second committer detects the conflict and must retry or fail.
A compaction job that spends 30 minutes rewriting files will fail if a streaming writer committed to the same partition during that window. On hot partitions receiving continuous writes, this makes compaction effectively impossible with naive scheduling. The standard mitigation is to compact only "cold" partitions — for event tables partitioned by date, compact yesterday while today receives writes. This works but requires partition-level scheduling logic the basic procedure does not provide.
With a control plane
Compaction is where the control plane delivers its most impactful differentiation over manual scripts, across four dimensions that scripts structurally cannot replicate.

Cross-engine sort-order optimization. LakeOps collects cross-engine query telemetry — which columns appear in WHERE, JOIN, and GROUP BY clauses from every engine reading each table: Trino, Spark, Snowflake, Athena, Flink, DuckDB. It determines the optimal sort order for the combined, real access pattern and applies it during compaction. When a new dashboard is deployed that filters on a previously-unqueried column, the telemetry captures the new pattern, the sort order updates, and the next compaction cycle reorders data to serve both the existing and new access patterns. This is continuous optimization — not a one-time configuration that decays as query patterns evolve.

Before committing a sort-order change on a large table, layout simulations validate the new strategy on a real Iceberg branch. The system creates a branch, applies the proposed sort order to a representative data subset, replays actual query patterns against the branch, and measures projected scan reduction. Only strategies that demonstrate measurable improvement are promoted to production. This eliminates the "sort by X, hope it helps, discover a week later it made things worse" cycle that manual sort-order tuning requires.
Rust/DataFusion execution engine. Compaction executes on a purpose-built engine using Apache DataFusion — native Rust, no JVM, no garbage collection pauses, no Spark cluster provisioning. This engine completes identical compaction workloads roughly 95% faster at roughly 90% lower cost per TB compared to Spark-based compaction. The speed difference makes continuous, event-driven compaction economically viable: rather than waiting for a nightly batch window while files accumulate, compaction triggers when a table's health score crosses a threshold, runs in minutes, and the table is clean before the next query hits it.
Event-driven triggers. Instead of fixed schedules, compaction triggers on health-signal changes: file count exceeds threshold, average file size drops below minimum, delete-file ratio crosses the configured limit, or sort-order alignment drifts from the optimal layout. Tables that do not need compaction are never compacted. Tables that need it urgently are compacted immediately. Compute spend correlates with actual need rather than calendar frequency.
Conflict-aware execution. The system identifies partitions with active streaming writers through commit-history analysis and excludes them from compaction scope. If an OCC conflict occurs despite this — an edge case during burst writes — the affected partition retries in the next maintenance cycle rather than failing the entire run. No human intervention, no wasted compute on retried work, no manual partition exclusion lists.
With manual scripts
-- Bin-pack compaction
CALL catalog.system.rewrite_data_files(
  table => 'analytics.events',
  strategy => 'binpack',
  options => map(
    'target-file-size-bytes', '536870912',
    'min-file-size-bytes', '67108864',
    'max-file-size-bytes', '1073741824',
    'min-input-files', '5',
    'partial-progress.enabled', 'true',
    'partial-progress.max-commits', '10',
    'delete-file-threshold', '3'
  )
);
-- Sort compaction
CALL catalog.system.rewrite_data_files(
  table => 'analytics.events',
  strategy => 'sort',
  sort_order => 'customer_id ASC NULLS LAST, event_date ASC',
  options => map(
    'target-file-size-bytes', '536870912',
    'min-file-size-bytes', '67108864',
    'partial-progress.enabled', 'true',
    'partial-progress.max-commits', '10'
  )
);
Parameter tuning guidance for manual compaction:
target-file-size-bytes: 512 MB (536870912) is the default and works for most analytical workloads. Reduce to 128–256 MB for tables dominated by highly selective queries where smaller files improve granularity of data skipping.min-file-size-bytes: Files above this size are not considered for rewriting. Set to 50–75% of target to avoid rewriting nearly-optimal files. Default is 75% of target.max-file-size-bytes: Upper bound. Set to 150–200% of target. Files above this were likely produced by a previous compaction with different settings.min-input-files: Minimum number of files in a partition before compaction activates. Setting this to 5 avoids rewriting partitions that have only 2–3 files, where the overhead exceeds the benefit.partial-progress.enabled: Alwaystruein production. The all-or-nothing default is unacceptable for any table with more than a few hundred files.delete-file-threshold: For MoR tables with V2 or V3 deletes, set to 1–5 depending on mutation frequency. Lower values keep reads clean; higher values reduce compaction frequency.
The structural limitations of manual compaction at scale are significant. Sort orders are static decisions made at table creation or DAG configuration time — they do not adapt as query patterns change. There is no mechanism to observe cross-engine query patterns; each engine's query history is siloed. OCC conflicts with streaming writers fail the run without automatic retry, requiring manual partition exclusion logic that itself must be maintained. Fixed schedules either waste compute on healthy tables or leave degraded tables waiting hours or days for the next window. And Spark's JVM overhead — cluster startup (2–5 minutes), garbage collection pauses, idle executor costs — makes continuous compaction economically impractical, forcing batch windows that accept periods of degraded performance.
Manifest rewriting
Manifests are Iceberg's file-level index — Avro files mapping data files to partitions and storing column-level statistics (min, max, null count, value count) for file-level pruning. Every query traverses manifests to determine which data files to read.
Each commit appends new manifest entries. Over months, a table with 2,000 data files might have 600–800 manifest files averaging 3–5 entries each, rather than 10–15 optimally-packed manifests. The planner issues a separate S3 GET for each — 600 manifest reads at 50–100ms each take 30–60 seconds; 15 reads take under 2 seconds. For selective queries, planning time can exceed data scan time by an order of magnitude.

Iceberg 1.11 introduced server-side scan planning, where the catalog resolves manifests and returns a pruned file list to the engine. This offloads traversal from each engine to the catalog — manifests are read once rather than once per engine. But it also concentrates the impact of fragmentation: a fragmented manifest set becomes a catalog-level bottleneck affecting all connected engines simultaneously.
Manifest rewriting must run after compaction. Compaction produces new data files and manifest entries — rewriting before compaction means the consolidated manifests are immediately fragmented by compaction's output.
With a control plane
LakeOps runs manifest rewriting as the final step in every maintenance cycle — always after compaction has established the new file layout. The system tracks manifest-to-data-file ratio as a health signal: a ratio above 1:10 (more than one manifest per 10 data files) indicates fragmentation worth addressing. Rewriting triggers only when the ratio crosses the configured threshold, avoiding unnecessary rewrites on already-consolidated tables.
As server-side scan planning adoption increases (Iceberg 1.11+), the control plane optimizes manifest layout not just for total count but for partition alignment — grouping manifest entries by partition to maximize the effectiveness of partition-level pruning during catalog-side planning.
With manual scripts
CALL catalog.system.rewrite_manifests(
  table => 'analytics.events'
);
The simplest of the four procedures — no parameters beyond the table name. It reads all manifests, consolidates them into fewer files, and commits the result atomically. Execution time depends on manifest count and total entry volume; for most tables it completes in seconds to minutes.
The most common mistake is scheduling manifest rewriting independently from compaction — manifests consolidated at midnight are immediately fragmented when compaction runs at 2 AM. In an Airflow DAG, manifest rewriting must be the final step, downstream of compaction. The second mistake: running it too frequently on stable tables. If no writes or compaction have occurred, the rewrite is pure overhead.
The sequencing dependency
The four operations form a dependency chain. Violating the sequence does not produce errors — it produces suboptimal results that are difficult to diagnose because everything appears to work.
Expire first because expiration dereferences files, reducing scope for everything downstream. Orphans second because they catch files freshly dereferenced by expiration — together, expiration and cleanup complete the lifecycle: dereference, then delete. Compact third because compaction should operate only on live data, not files about to be garbage-collected. Manifests last because they must reflect the post-compaction layout — rewriting before compaction means the clean index is immediately invalidated.
# Airflow DAG with correct sequencing
expire_task = SparkSubmitOperator(...)
orphan_task = SparkSubmitOperator(...)
compact_task = SparkSubmitOperator(...)
manifest_task = SparkSubmitOperator(...)
expire_task >> orphan_task >> compact_task >> manifest_task
A control plane enforces this as a single atomic pipeline per table — the four steps are not independently schedulable. Manual orchestration must enforce it through DAG dependencies, which works within one DAG but breaks when teams split operations across independent schedules (common when different engineers own different aspects of maintenance, or when operations are added incrementally over months without holistic review of the dependency graph).
Beyond maintenance: multi-engine query routing
Production lakehouses run multiple engines against the same Iceberg tables — Trino for dashboards, Spark for ETL, Snowflake for BI, DuckDB for ad-hoc, Athena for serverless. Each has radically different cost and latency profiles. A point lookup costing fractions of a cent on DuckDB costs dollars on Snowflake. Without routing, applications hardcode engine connections and every query goes to one engine regardless of whether a better option exists.

Maintenance and routing interact bidirectionally. Well-compacted, properly sorted tables unlock routing options that degraded tables cannot support. A table sorted by customer_id can serve point lookups through DuckDB (single file read via data skipping). An unsorted version requires scanning most files, exceeding DuckDB's capacity and requiring Trino's distributed execution. Maintenance directly expands viable routing destinations.
How routing works with a control plane
LakeOps includes QueryFlux — an open-source Rust-based SQL proxy that provides multi-engine query routing with protocol translation, capacity management, and per-query observability. Applications connect to a single SQL endpoint. The routing layer parses each query, classifies its shape (point lookup, bounded aggregation, complex multi-table join, full scan, DDL), and dispatches it to the optimal engine based on cost targets, latency requirements, current engine capacity, and table health state.

Protocol translation means applications do not change SQL dialect or connection drivers when routing shifts a query between engines. A BI dashboard that always connected to Trino can be served by whichever engine is optimal for each query — without changing the dashboard's configuration.
Because the control plane possesses cross-engine telemetry and table health data, routing integrates with maintenance signals. A Critical table (fragmented, unsorted) routes to engines that handle degradation better — Trino over DuckDB. As maintenance resolves issues, more engines become eligible, and routing shifts to cheaper options automatically.
Engine management provides a unified console: register engines, compare metrics side-by-side (success rate, p50/p95/p99 latency, cost per query), and trigger maintenance mode — which excludes the engine from routing and fails over in-flight queries. The routing and maintenance layers form a reinforcing loop: maintenance unlocks cheaper routing; routing telemetry feeds better compaction decisions. Both improve simultaneously.
Without a control plane
Teams without routing typically hardcode engine connections per application. There is no mechanism to optimize per-query, no visibility into cross-engine costs, no failover when an engine degrades, and no feedback loop between table health and engine selection. This works but leaves significant cost optimization on the table. A control plane like LakeOps closes that gap by making routing and maintenance a single integrated system.
Beyond maintenance: observability and governance
You cannot maintain what you cannot see. Iceberg includes no native observability — no health dashboards, no cross-engine telemetry, no alerting, no audit trails. Teams running scripts typically discover degradation when a user complains about a slow dashboard — not through proactive monitoring.
Cross-engine observability
The observability layer in a control plane provides three capabilities that no single engine — and no combination of per-engine monitoring — can replicate:
Unified table health classification. Every table is continuously scored as Healthy, Warning, or Critical based on combined signals: file count, average file size, manifest-to-data-file ratio, snapshot depth, sort-order alignment with real query patterns, orphan volume, and delete-file accumulation. A Critical table with 80,000 fragmented files impacting a production dashboard gets compacted before a Warning table with moderate sort drift on a batch pipeline.

Cross-engine query telemetry. LakeOps collects which columns are filtered, joined, and grouped across every connected engine. Trino knows its own queries; Spark knows its own. Only the control plane knows that 60% of all queries filter on customer_id and 35% on event_date — information that drives sort-order selection, compaction prioritization, and routing. When a new Snowflake consumer adds a different filter pattern, sort-order recommendations adapt automatically.
Operation audit trail. Every maintenance operation logged with full context: what ran, when, duration, files before/after, bytes reclaimed, health score change, and the signal that triggered it. For compliance environments (GDPR Article 5, SOC2 CC6.5, HIPAA), the audit trail provides evidence that manual operations require custom logging to produce.
Policy-based governance
At scale, per-table configuration becomes governance entropy. Retention windows drift. Some tables get compacted; others are forgotten. New tables inherit nothing.

Declarative policies with hierarchical inheritance solve this: define compaction strategy, target file size, snapshot retention, and cleanup thresholds at organization, catalog, namespace, or table level. Policies cascade downward. New tables automatically inherit. The platform team sets defaults (7-day retention, 512 MB target, sort compaction enabled); the data engineering team overrides for streaming (3-day retention, bin-pack); individual table owners override for specific requirements (90-day retention for audit tables). All versioned, auditable, reversible.

Manual observability
Teams without a control plane assemble observability from Spark SQL queries against metadata tables, custom Prometheus exporters, Grafana dashboards, and PagerDuty alerts. This works but carries significant engineering cost: each component must be maintained as Iceberg evolves, the monitoring itself consumes compute, and cross-engine telemetry requires instrumenting each engine independently.
This scales to 10–50 tables with dedicated engineering investment. Beyond that, the cost of maintaining the monitoring system rivals the cost of the degradation it is trying to prevent.
Choosing your approach
Use a control plane when table count exceeds 50, streaming workloads create continuous accumulation, multiple engines read the same tables, sort optimization matters but patterns change, compliance requires audit trails, or engineering time is better spent on products than scripts.
Use manual scripts when you have fewer than 30–50 tables with stable batch workloads, a single engine per table, low mutation rates, and capacity to maintain the orchestration infrastructure indefinitely. Many teams start here and migrate to a control plane as complexity grows.
Control plane path: Connect your catalogs to LakeOps — minutes to set up, no data movement, no infrastructure changes. Review health classification across your lake — most teams discover 15–30% of tables in Warning or Critical state. Start in manual-approval mode. Define policies at the namespace level. Enable autonomous maintenance once you see results on initial tables.
Manual path: Implement the four operations as a single Airflow DAG: expire → orphans → compact → manifests. Use partial-progress.enabled = true for compaction. Set orphan retention to 7+ days. Exclude active streaming partitions. Run on dedicated compute. Monitor per-partition file count as a first-class metric. Plan for ongoing engineering cost as table count grows.
In both paths: data never leaves your storage. Maintenance operates through standard Iceberg APIs — metadata reads and atomic commits through your catalog. No proprietary formats, no lock-in.
Thanks for reading and please feel free to share your exprience in the comments 🙏
Cheers 🍺
Further learning:
- Autonomous Iceberg Table Maintenance — the full guide to closed-loop maintenance automation
- Iceberg Table Health and Maintenance — health scoring, classification, and lifecycle management
- Iceberg Compaction Tools Compared — side-by-side evaluation of production compaction options
- Iceberg Compaction Strategies — bin-pack vs. sort vs. Z-order in depth
- Iceberg Lakehouse Observability Guide — the pillars of operational lake monitoring
- Routing Multiple Query Engines with Iceberg — QueryFlux and multi-engine dispatch architecture
- Fixing Small Files in Apache Iceberg — root causes, detection, and resolution patterns
- Iceberg Cost Optimization — storage, compute, and operational cost vectors and how to eliminate them