

When running Large Language Models (LLMs) locally, performance monitoring is a constant anxiety. As the context window swells, I often watch the Copilot CLI "think" for agonizingly long stretches. This triggers the immediate, crucial question: Is this lag due to context bloat, or has my GPU finally hit its VRAM ceiling?
The problem is that existing resource monitors are fragmented. To answer that single question, I found myself trapped in a cycle of constant context-switching:
- Flick to the terminal to check
llama.cpplogs for token rates. - Jump to
rocm-smito check GPU utilization. - Switch to
htopto monitor CPU load. - Return to the Copilot console.
This wasn't just distracting; it was actively breaking my flow. I didn't need more tools; I needed one single pane of glass which is a dashboard that reflected the true state of the machine right where my eyes naturally rest.
The Discovery: Telemetry in Plain Sight
The solution wasn't to build a heavy, separate monitoring server, but to tap into the telemetry the tools were already emitting.
While raw terminal output is noisy, I discovered that the llama.cpp server exposes a standardized endpoint emitting real-time metrics in Prometheus format. This transforms "random logs" into structured, time-series data—the perfect fuel for a lightweight monitoring tool.
Since I operate heavily within the Linux ecosystem, I decided to bring this data directly to my desktop using the Cinnamon Desktop applet system. I built a lightweight widget designed to watch the server, read the kernel, and present a unified performance view.
The Vision: A Glance
My goal was simple: present LLM performance metrics (Prompt Rate, Generation Rate) alongside critical hardware health indicators (Temp, GPU Load, VRAM Usage) in a single, glanceable widget.
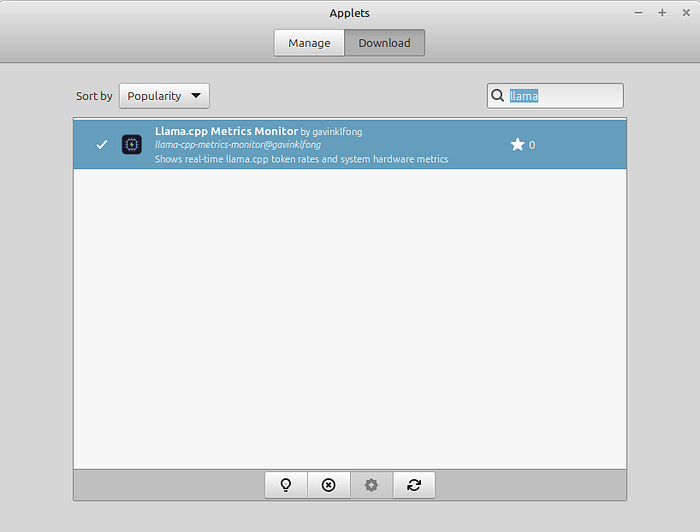
The applet has been published to Cinnamon official repo. You can search by the name "llama.cpp metrics monitor", it is available for download and install on your Linux desktop if your workstation are running Cinnamon window manager.
Feel free to check out this Git repo and try it out.
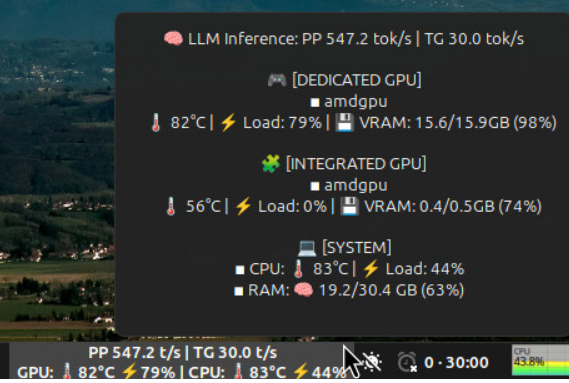
To maximize the limited real estate of a desktop widget, the display logic dynamically adapts to the user's hardware configuration:
- Dedicated GPU: Displays GPU and CPU stats.
- Multiple Dedicated GPUs: Displays the first two GPUs.
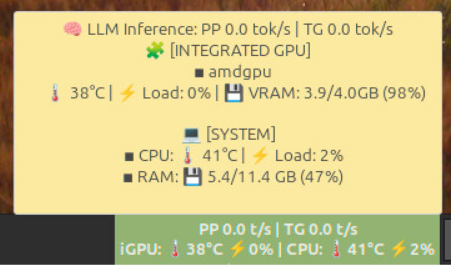
- No Dedicated GPU: Seamlessly pivots to display Integrated GPU (iGPU) and CPU metrics.
Dedicated GPU in action. The widget provides an immediate visual cue of the token generation rate versus GPU temperature.
Running on integrated graphics. The system pivots to display CPU and iGPU metrics while maintaining a unified structure.
️ Deconstructing the System Design
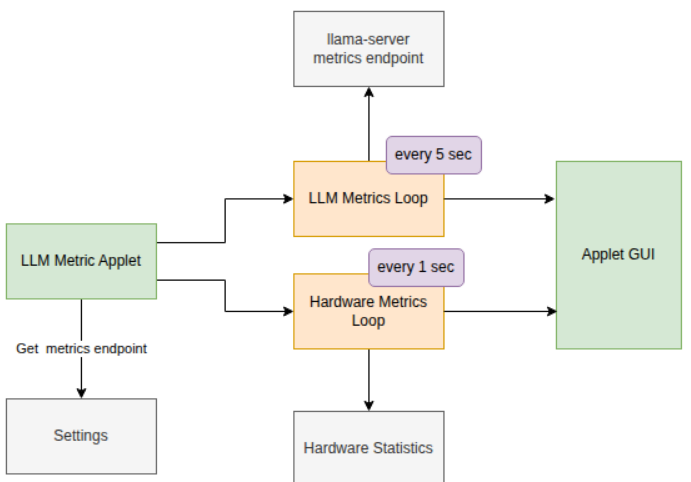
The architecture splits the intelligence into two distinct components:
- The Backend (The Watchdogs): Two asynchronous loops constantly polling the LLM server's metrics endpoint and the OS hardware statistics.
- The Frontend (The Canvas): A Cinnamon Applet responsible for aggregating this data and rendering it via the desktop shell.
Part 1: Taming the LLM Metrics
When started with the --metrics flag, the llama.cpp server serves data at http://localhost:11434/metrics. This endpoint provides vital statistics such as llamacpp:prompt_tokens_total and llamacpp:predicted_tokens_seconds.
The Challenge of Rate Calculation
Token rate is mathematically defined as the change in cumulative tokens (ΔC) over the change in time (Δt). However, I hit a significant hurdle: data lagging.
Because these metrics are cumulative counters, if I polled every second, llama.cpp often hadn't yet flushed the latest increment to the endpoint. This resulted in ΔC=0, causing the widget to display a confusing "0.00 tokens/s" while the model was actually working hard.
The "Zero Rate" Fallback Trick
To solve this, I implemented a two-step logic:
- Increased Polling Cadence: I set a slightly slower polling interval (e.g., 5 seconds). If ΔC is still zero after 5 seconds, the widget falls back to the cumulative average rate provided directly in the metrics as a sensible estimate.
- State-Awareness: To distinguish between "The model is idle" and "The data hasn't updated yet," I used the
llamacpp:requests_processinggauge.
- If
requests_processing == 0, the model is truly idle → Display 0 tokens/s. - If
requests_processing > 0but ΔC is 0 → Display fallback cumulative average.
Here is the sample code of the token rate calculation:
// 1. Extract metrics from the Prometheus response body
const activeRequests = extractCounter(body, "llamacpp:requests_processing");

const totalPromptTokens = extractCounter(body, "llamacpp:prompt_tokens_total");
const totalPromptTime = extractCounter(body, "llamacpp:prompt_seconds_total");
const avgPromptRate = extractCounter(body, "llamacpp:prompt_tokens_seconds");

const totalPredTokens = extractCounter(body, "llamacpp:tokens_predicted_total");
const totalPredTime = extractCounter(body, "llamacpp:tokens_predicted_seconds_total");
const avgPredRate = extractCounter(body, "llamacpp:predicted_tokens_seconds");

// 2. Helper to calculate delta-based rate with fallback to average rate
const getRate = (total, lastTotal, time, lastTime, avg, lastRate) => {
    let rate = lastRate;
    if (lastTotal > 0) {
        const dTokens = total - lastTotal;
        const dTime = time - lastTime;
        if (dTokens > 0 && dTime > 0) rate = dTokens / dTime;
    }
    return (rate === 0 && avg > 0) ? avg : rate;
};

let currentPromptRate = 0;
let currentGenRate = 0;

// 3. Calculate rates only if there are active requests
if (activeRequests > 0) {
    currentPromptRate = getRate(totalPromptTokens, this._lastPromptTokens, totalPromptTime, this._lastPromptTime, avgPromptRate, this._lastPromptRate);
    currentGenRate = getRate(totalPredTokens, this._lastPredTokens, totalPredTime, this._lastPredTime, avgPredRate, this._lastGenRate);
}
Part 2: Reading the Kernel (Hardware Stats)
To peer beneath the hood, I tapped into the Linux kernel's hwmon interface located under /sys/class/hwmon/. This directory acts as a unified interface for all attached sensors.
By inspecting the name file within each hwmon* directory, I could identify specific drivers (e.g., amdgpu, k10temp).
Pro Tip: Identifying GPUs via Heuristics
Distinguishing a high-power dedicated GPU from an integrated iGPU can be tricky via software alone. I found a reliable heuristic: Dedicated GPUs almost always expose a power1_cap file within their monitoring folder. Checking for the existence of this file allows the applet to automatically detect and prioritize dedicated hardware.
Once identified, extracting data is a simple matter of file I/O:
- Temperature: Reading
tempX_input. - VRAM Usage: Reading
device/mem_info_vram_usedvsdevice/mem_info_vram_total. - GPU Load: Reading
device/gpu_busy_percent.
Part 3: Building the Visual Experience
The frontend was the final piece of the puzzle. Because Cinnamon Applets use a specific, low-level JavaScript environment (distinct from Node.js), the learning curve was steep.
This is where LLM-assisted coding proved its worth. I used Copilot as a "scaffolding agent," rapidly generating the boilerplate for asynchronous HTTP requests, file system reads, and the complex GUI binding functions required by the Cinnamon shell. This allowed me to focus on the core logic — the synchronization of hardware and software telemetry — rather than fighting with syntax.
Final Thoughts
This project demonstrates the power of leveraging existing data. Rather than building a heavy, resource-intensive monitoring suite, I utilized the telemetry already being emitted by llama.cpp and the standardized interfaces of the Linux kernel. The result is a lightweight, high-visibility dashboard that bridges the gap between software performance and hardware health, providing the high-level insights necessary to optimize local LLM workflows without overhead.
Feel free to check out this Git repo and try it out.